Skip to content
YinYang
strategyActiveOpen Source

YinYang RSI Volume Trend Strategy

Backtest long and short zone entries weighted by volume and RSI, with basis exits and stop handling.

AlertsSource updated 2023-09-17Reviewed 2026-07-19
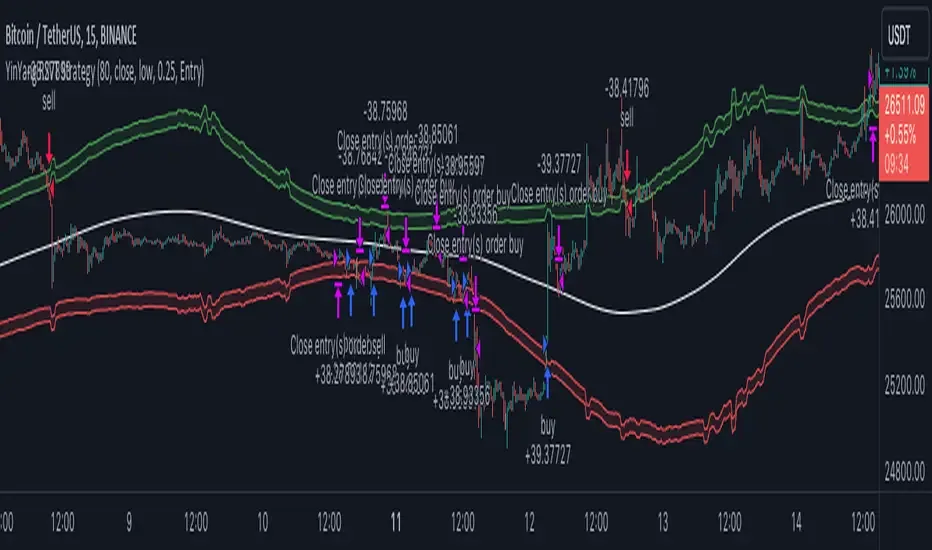
YinYang RSI Volume Trend Strategy publication chart on TradingView

Overview

Backtest long and short zone entries weighted by volume and RSI, with basis exits and stop handling.

The strategy builds high and low purchase zones from price, volume, and RSI-weighted calculations. Long and short entries use inner-zone crosses, with configurable outer-zone stops, basis-line take profit, and opposing-zone exits.

Key capabilities

  • RSI- and volume-weighted zones
  • Long and short entries
  • Configurable stop loss
  • Basis-line take profit
  • TradingView strategy report

Configuration

Start with the documented controls

  • Choose entry and exit sources.
  • Configure stop and purchase-reset behaviour.
  • Add realistic commission and slippage before interpreting results.

Tutorial

Learn the workflow in context

Step 1

How it works

The strategy builds high and low purchase zones from price, volume, and RSI-weighted calculations. Long and short entries use inner-zone crosses, with configurable outer-zone stops, basis-line take profit, and opposing-zone exits.

  • RSI- and volume-weighted zones
  • Long and short entries
  • Configurable stop loss
  • Basis-line take profit
  • TradingView strategy report

Step 2

Set up the script

Open the original publication, choose Use on TradingView, then add the script to the intended symbol and timeframe. Review each input before relying on the display; defaults are a starting point, not a universal recommendation.

  • Choose entry and exit sources.
  • Configure stop and purchase-reset behaviour.
  • Add realistic commission and slippage before interpreting results.

Step 3

Create an alert

All current YinYang publications support TradingView alerts. Select a condition exposed by the script, confirm the symbol and timeframe, and test notifications before relying on them. This Alerts label does not by itself mean a webhook execution workflow has been verified.

Risk and results context

Strategy reports are historical and hypothetical. Results can change materially with symbol, timeframe, date range, settings, commission, slippage, liquidity, and execution conditions.

Signals, projections, and strategy outputs are analytical tools—not financial advice or guarantees of future results. Trading involves substantial risk.

No numerical performance claim is presented here because symbol, timeframe, tested date range, settings, commission, and slippage must be shown together. Review those parameters inside TradingView before interpreting any strategy report.

This guide is a rewritten YinYang overview. For the author’s complete source description and release notes, view the original publication.

Related scripts

Continue exploring the library

Ultimate

Use the complete TradingView library

Ultimate combines the web analytics platform with all six featured invite-only TradingView tools.

TradingView® is a trademark of TradingView, Inc. YinYang Algorithms is not affiliated with or endorsed by TradingView. A separate TradingView account is required; paid TradingView plans are not included.