
Step 1
Open Time Series
Use the workspace view selector and choose Time Series after market data is ready.
Compare BTC/USDT candle structure, pressure, volume, trade count, and whale participation row by row.
7 minute read · Intermediate · Updated 2026-07-19
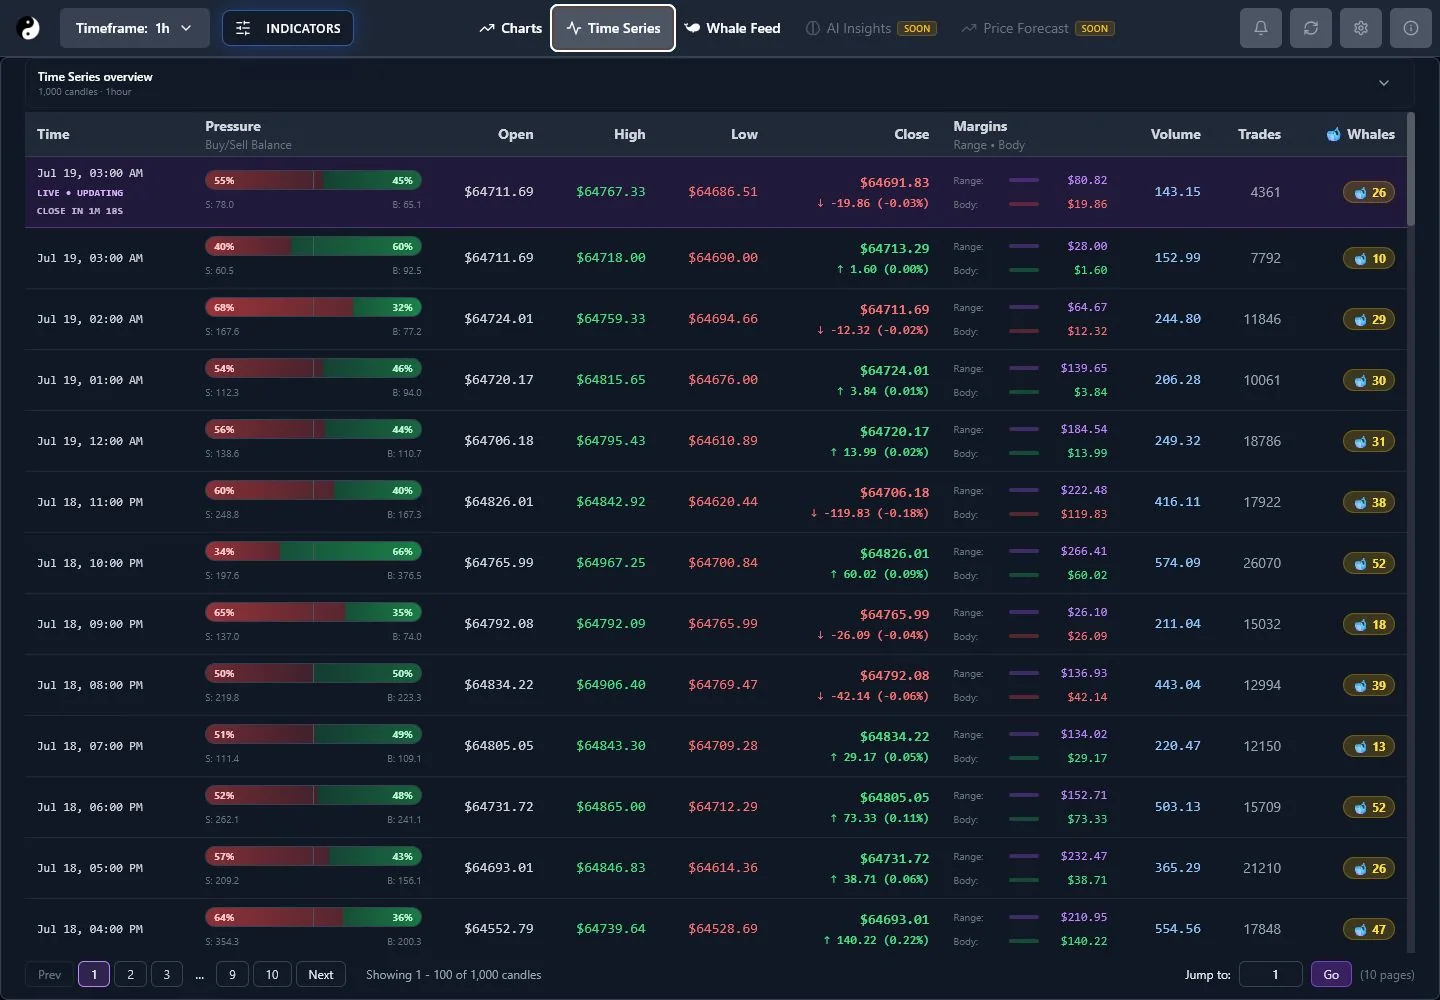
Step 1
Use the workspace view selector and choose Time Series after market data is ready.
Step 2
Align the timestamp, open, high, low, and close with the corresponding chart interval before interpreting the participation fields.
Step 3
Pressure, volume, trades, and whale activity add context. No single column is an automatic trading signal.