
Step 1
Set the timeframe
Use the timeframe control in the chart header. A timeframe change can temporarily defer indicators while the new candle series becomes authoritative.
Read the chart shell, timeframe controls, overlays, volume profile, and the mobile layout.
7 minute read · Beginner · Updated 2026-07-16
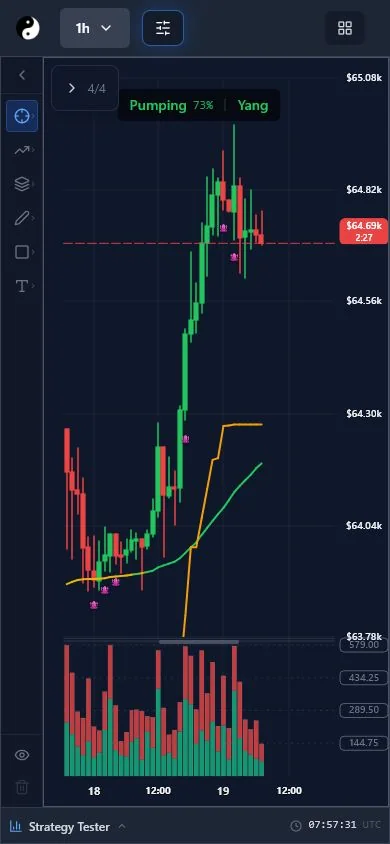
Step 1
Use the timeframe control in the chart header. A timeframe change can temporarily defer indicators while the new candle series becomes authoritative.
Step 2
The Overlays control lists visible chart layers. Price, volume profile, indicator output, and drawing tools should be interpreted together rather than as isolated signals.
Step 3
On narrow screens, primary controls remain at the top and the view selector condenses into a touch-friendly menu. Rotate only when more horizontal chart context is useful.