
Step 1
Enable the profile
Open Indicators or the applicable overlay control and enable Volume Profile for the current chart context.
Read volume distribution by price without letting profile bars obscure the price structure.
7 minute read · Intermediate · Updated 2026-07-19
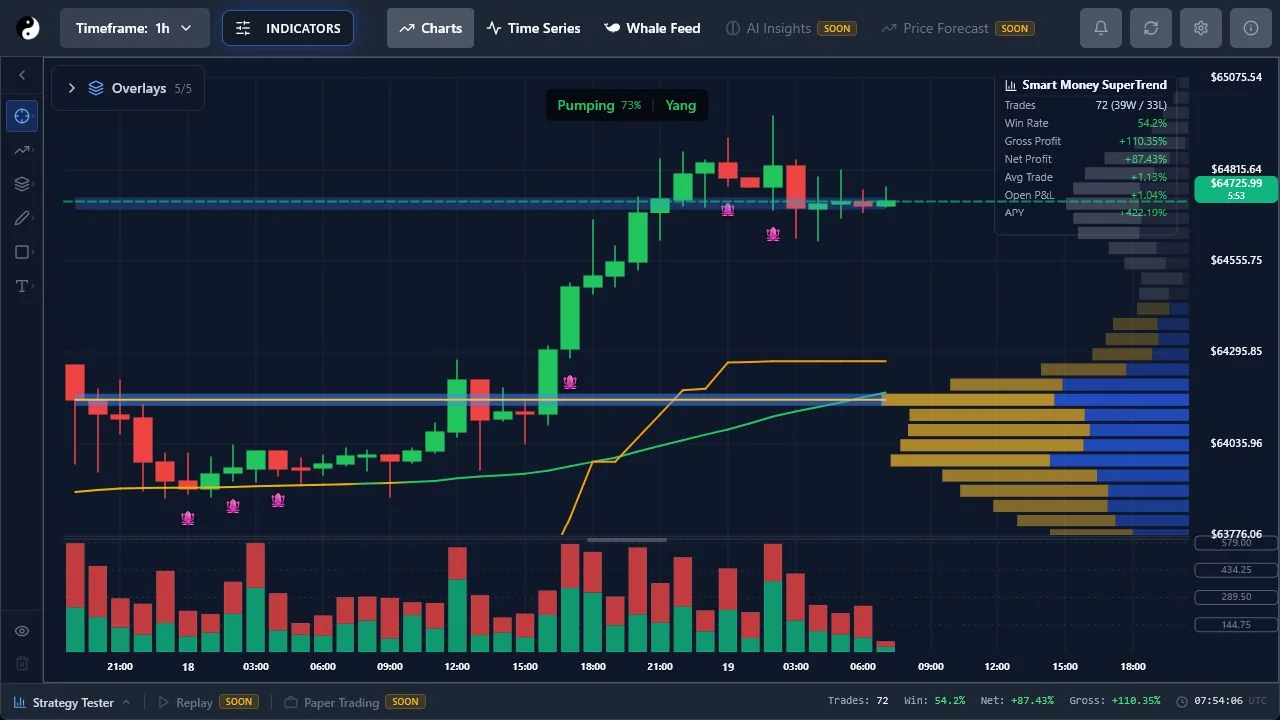
Step 1
Open Indicators or the applicable overlay control and enable Volume Profile for the current chart context.
Step 2
Longer bars show more volume at those price levels within the configured context; they do not predict direction on their own.
Step 3
Adjust chart zoom and overlay settings so the profile supports, rather than hides, candle structure.